Fuel Economy Data Analysis
Table of Contents
- Introduction
- Prerequisites
- File Description
- Data Overview
- Data Analysis Process
- Results
- Acknowledgements
Introduction
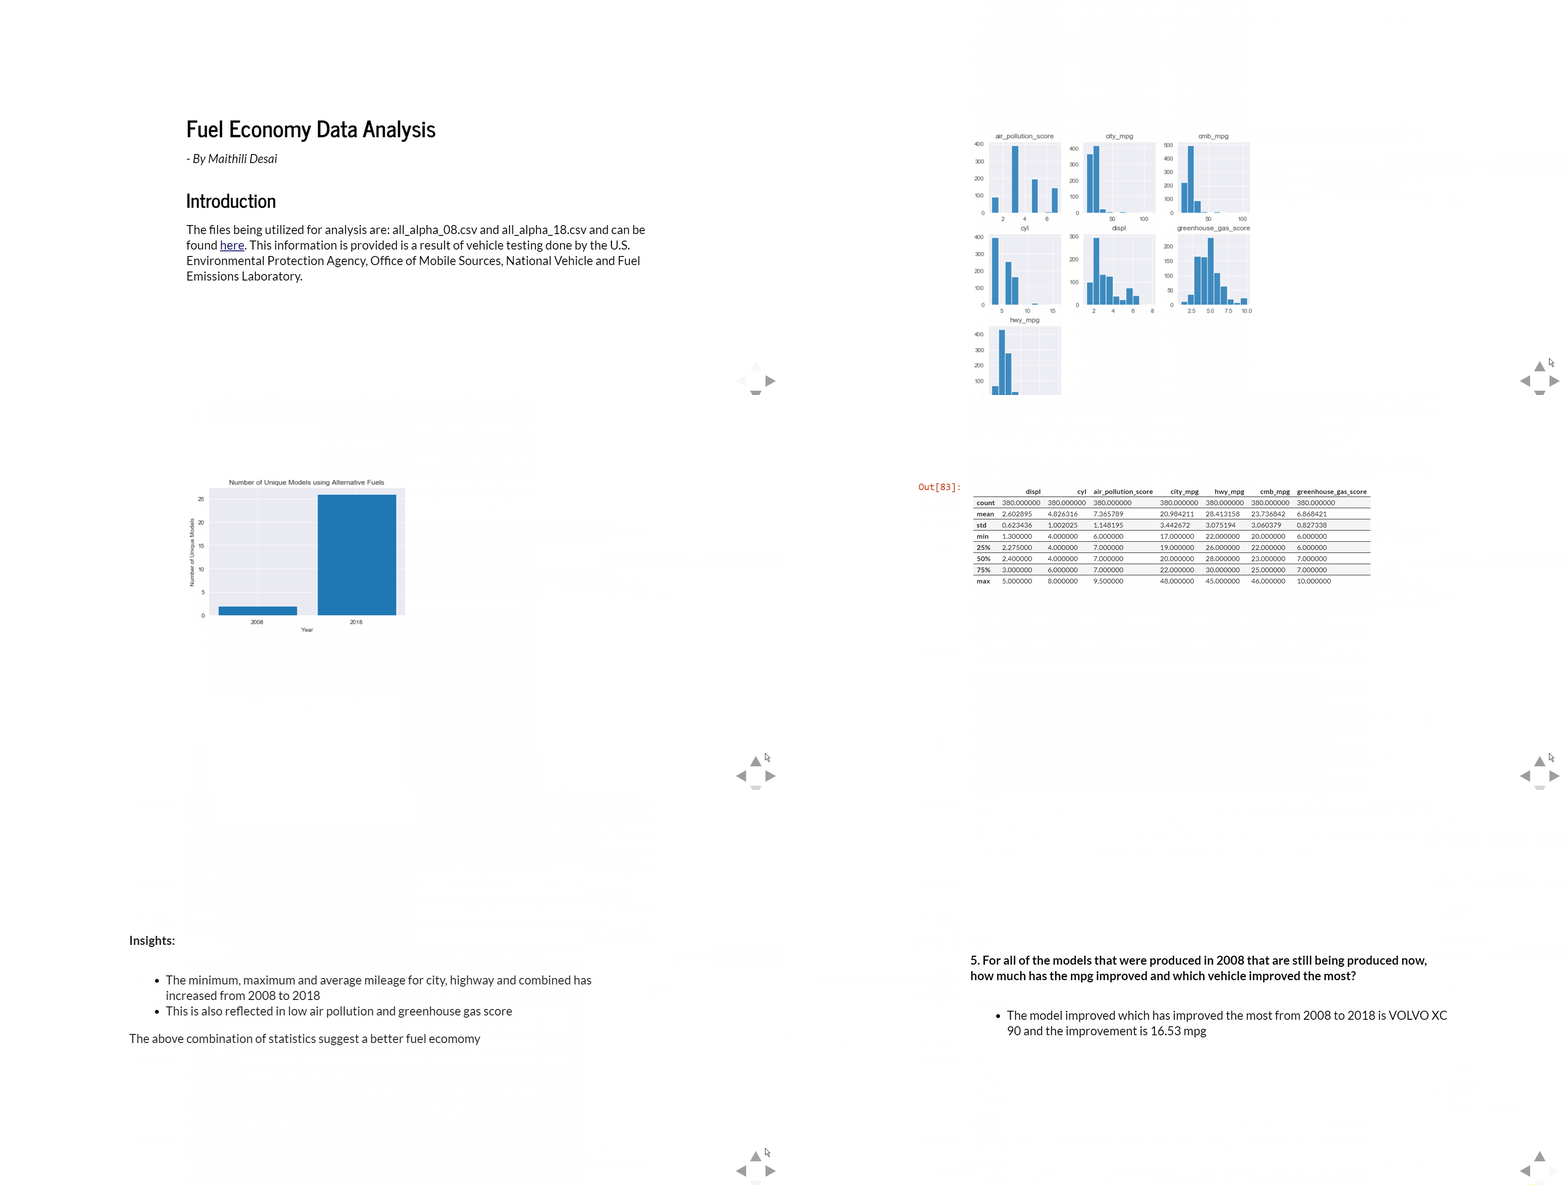
The files being utilized for analysis are: all_alpha_08.csv and all_alpha_18.csv and can be found here. The information provided is a result of vehicle testing done by the U.S. Environmental Protection Agency, Office of Mobile Sources, National Vehicle and Fuel Emissions Laboratory. I’ll also answer the following questions which I have constructed after initial assessment of the data:
- Are more unique models using alternative sources of fuel? By how much?
- How much have vehicle classes improved in fuel economy?
- What are the characteristics of SmartWay vehicles? Have they changed over time?
- What features are associated with better fuel economy?
- For all of the models that were produced in 2008 that are still being produced now, how much has the mpg improved and which vehicle improved the most?

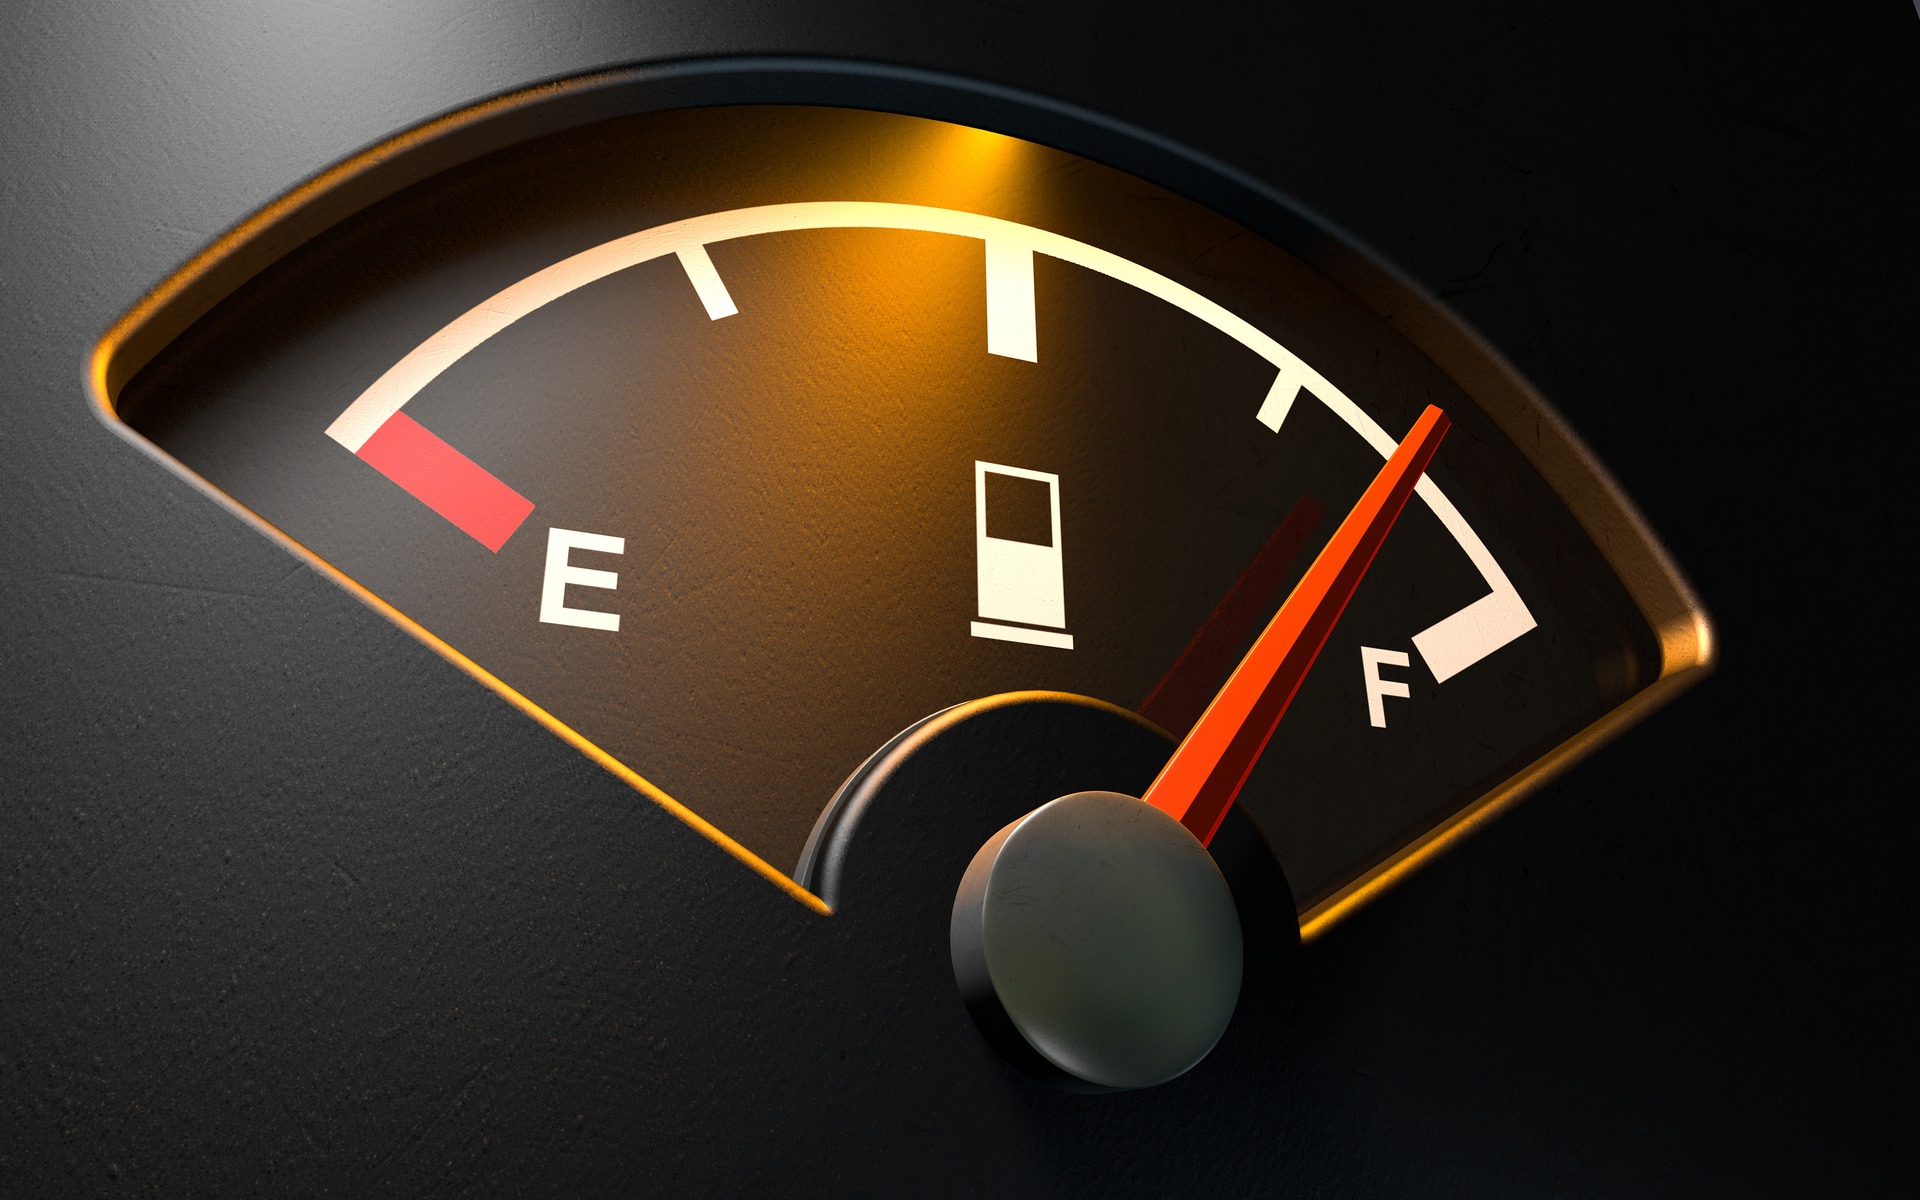
(Source: Shared Mobility News)
Prerequisites
- Pandas (for data loading and analysis)
- NumPy (for computing)
- Matplotlib (for visualizations)
- Seaborn (for visualizations)
- Jupyter (to run notebooks)
File Description
There are three folders:
- Code
- Fuel Economy Data Analysis.ipynb- covers the entire analysis process performed to investigate both datasets as well as the documentation
- Data
- all_alpha_08: Fuel Exonomy Dataset for the year 2008
- all_alpha_18: Fuel Exonomy Dataset for the year 2018
- clean_08: 2008 Dataset after assessing and cleaning the quality issues
- clean_18: 2018 Dataset after assessing and cleaning the quality issues
- combined_dataset: Master Dataset containing both 2008 and 2018 cleaned datasets
- GreenVehicleGuideDocumentation.pdf- EPA Green Vehicle Guide and SmartWay List Documentation. This guide may aid better understanding of the columns utilized in this dataset and their purpose
- Presentation
- fuel_economy_data_presentation.slides.html: Slideshow providing insights on questions
- presentation.gif: Preview of presentation

- Images
- fuel-image.jpg
Data Overview
- There are two datasets for the year 2008 and 2018.
- 2008 dataset has 18 attributes and 2404 observations
- 2018 dataset has 18 attributes and 1611 observations
- These datasets have the following attributes:
- Model: Vehicle make and model
- Displ: Engine displacement (the size of an engine in liters)
- Cyl: The number of cylinders in a particular engine
- Trans: Transmission Type and Number of Gears
- Drive: Drive axle type (2WD = 2-wheel drive, 4WD = 4-wheel/all-wheel drive)
- Fuel: Fuel Type
- Cert Region*: Certification Region Code
- Sales Area:** Certification Region Code
- Stnd: Vehicle emissions standard code
- Stnd Description*: Vehicle emissions standard description
- Underhood ID: This is a 12-digit ID number that can be found on the underhood emission label of every vehicle. It’s required by the EPA to designate its “test group” or “engine family.”
- Veh Class: EPA Vehicle Class
- Air Pollution Score: Air pollution score (smog rating)
- City MPG: Estimated city mpg (miles/gallon)
- Hwy MPG: Estimated highway mpg (miles/gallon)
- Cmb MPG: Estimated combined mpg (miles/gallon)
- Greenhouse Gas Score: Greenhouse gas rating
- SmartWay: Yes, No, or Elite
- Comb CO2*: Combined city/highway CO2 tailpipe emissions in grams per mile
Note:
- *Not included in 2008 dataset
- ** Not included in 2018 dataset
Data Analysis Process
- Data Gathering - Fuel Economy data was gathered for the years 2008 and 2018
- Data Assessment - Data was assessed for quality issues
- Data Cleaning
- Dropping extraneous columns
- Renaming columns for consistency
- Filtering
- Droping nulls
- Deduping
- Inspecting and correcting the data types
- Exploratory Visuals - Visually assessing the distribution of features and their correlation
- Drawing Conclusions
- Total 5 questions were constructed and answered using a data driven approach
Results
1. Are more unique models using alternative sources of fuel? By how much?
- Available alternative sources of fuel are CNG and ethanol in 2008 and ethanol and electricity in 2018
- The proportions are 0.0053 for 2008 and 0.072 for 2018
2. How much have vehicle classes improved in fuel economy?
- Midsize cars have improved the most in fuel economy from 2008 to 2018 by 6.28 combined mpg
- Least improvement is shown by mini vans which is 1.68 combined mpg
3. What are the characteristics of SmartWay vehicles? Have they changed over time?
- The mean has increased from 2008 to 2018 for city mpg, highway mpg, combined mpg showing drastic improvement in mileage
- For the rest of the characteristics like engine size, air pollution score and green house gas score, the average is lower in 2018
- This means that over time the engine size has descreased increasing the mileage and lowering pollution caused by the vehicles which is assessed using air pollution score and green house gas score in this dataset
4. What features are associated with better fuel economy?
- The minimum, maximum and average mileage for city, highway and combined has increased from 2008 to 2018
- This is also reflected in low air pollution and greenhouse gas score
The above combination of statistics suggest a better fuel ecomomy
5. For all of the models that were produced in 2008 that are still being produced now, how much has the mpg improved and which vehicle improved the most?
- The model improved which has improved the most from 2008 to 2018 is VOLVO XC 90 and the improvement is 16.53 mpg
Acknowledgements
The datasets can be found here.